















Attachment Details
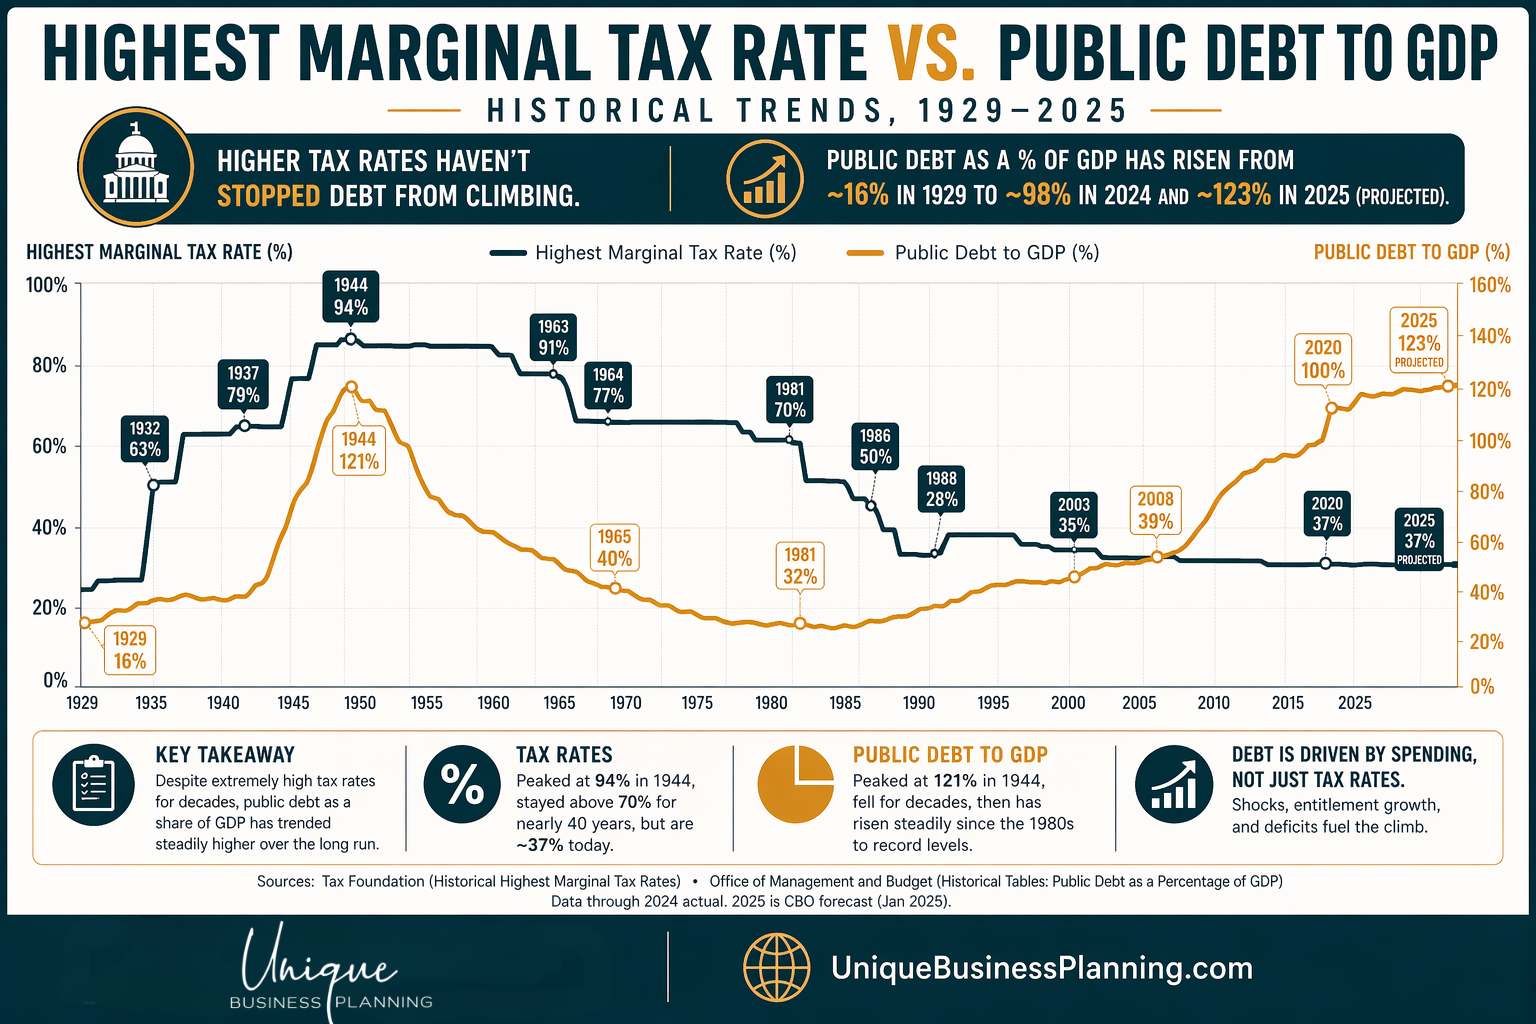
Highest_Marginal_Tax_Rate_VS_Public_Debt_To_GDP Chart
What History Tells Us About Taxes, Debt, and the Future
When you zoom out and view the long-term relationship between marginal tax rates and public debt, the data begins to tell a deeper story—one shaped not just by policy, but by pivotal moments in history.
1940s — World War II
Debt surged to over 100% of GDP as the U.S. financed the war effort. In response, top marginal tax rates climbed above 90%. This period reflects one of the most aggressive combinations of high debt and high taxation in U.S. history.
1950s–1960s — Post-War Expansion
Despite elevated debt levels, the U.S. experienced strong economic growth. High marginal tax rates remained in place, but expanding productivity and population growth helped bring debt levels down over time.
1980s — Reagan Era Tax Cuts
A major shift in policy. Marginal tax rates were significantly reduced, ushering in a new era of lower taxation. At the same time, deficits began to expand again—marking a turning point in the relationship between taxes and debt.
2008 — Global Financial Crisis
Government spending surged to stabilize the financial system. Debt levels accelerated sharply, while tax rates remained relatively moderate compared to historical highs.
2020 — COVID-19 Pandemic
Massive fiscal stimulus pushed debt levels higher once again. This created one of the most unusual environments in modern history: very high debt paired with relatively low tax rates.
The Real Pattern
Looking across these periods, one thing becomes clear:
Debt doesn’t rise or fall in isolation—it moves alongside major economic events, policy decisions, and national priorities.
And while tax rates have historically adjusted in response to these pressures, the timing and magnitude have never been predictable.
What This Means Going Forward
Today’s environment stands out.
We are at historically elevated debt levels, yet tax rates remain well below past peaks. That gap raises important questions about how future policy may evolve—but more importantly, it reinforces the need for preparation over prediction.
Why This Matters for Investors
For investors, the lesson isn’t to react to headlines—it’s to recognize the broader environment:
- Policy shifts can and do happen
- Tax landscapes evolve over time
- Long-term strategies must be flexible and resilient
That’s why a thoughtful approach often includes:
- Tax diversification across account types
- Long-term discipline through changing environments
- Avoiding emotional, short-term decisions based on uncertainty
The Bigger Picture
Every point on this chart represents a moment when the future felt uncertain.
Wars. Crises. Policy shifts.
And yet, through all of it, disciplined investors who stayed focused on long-term principles were the ones who ultimately succeeded.
This chart isn’t about predicting what comes next.
It’s about understanding what’s happened before—and using that perspective to move forward with clarity and confidence.